Anti-Muslim Attacks in 2015
Title: Bridge Initiative Special Report | 2015 | Anti- Muslim Attacks in 2015 | Published May 2 2016
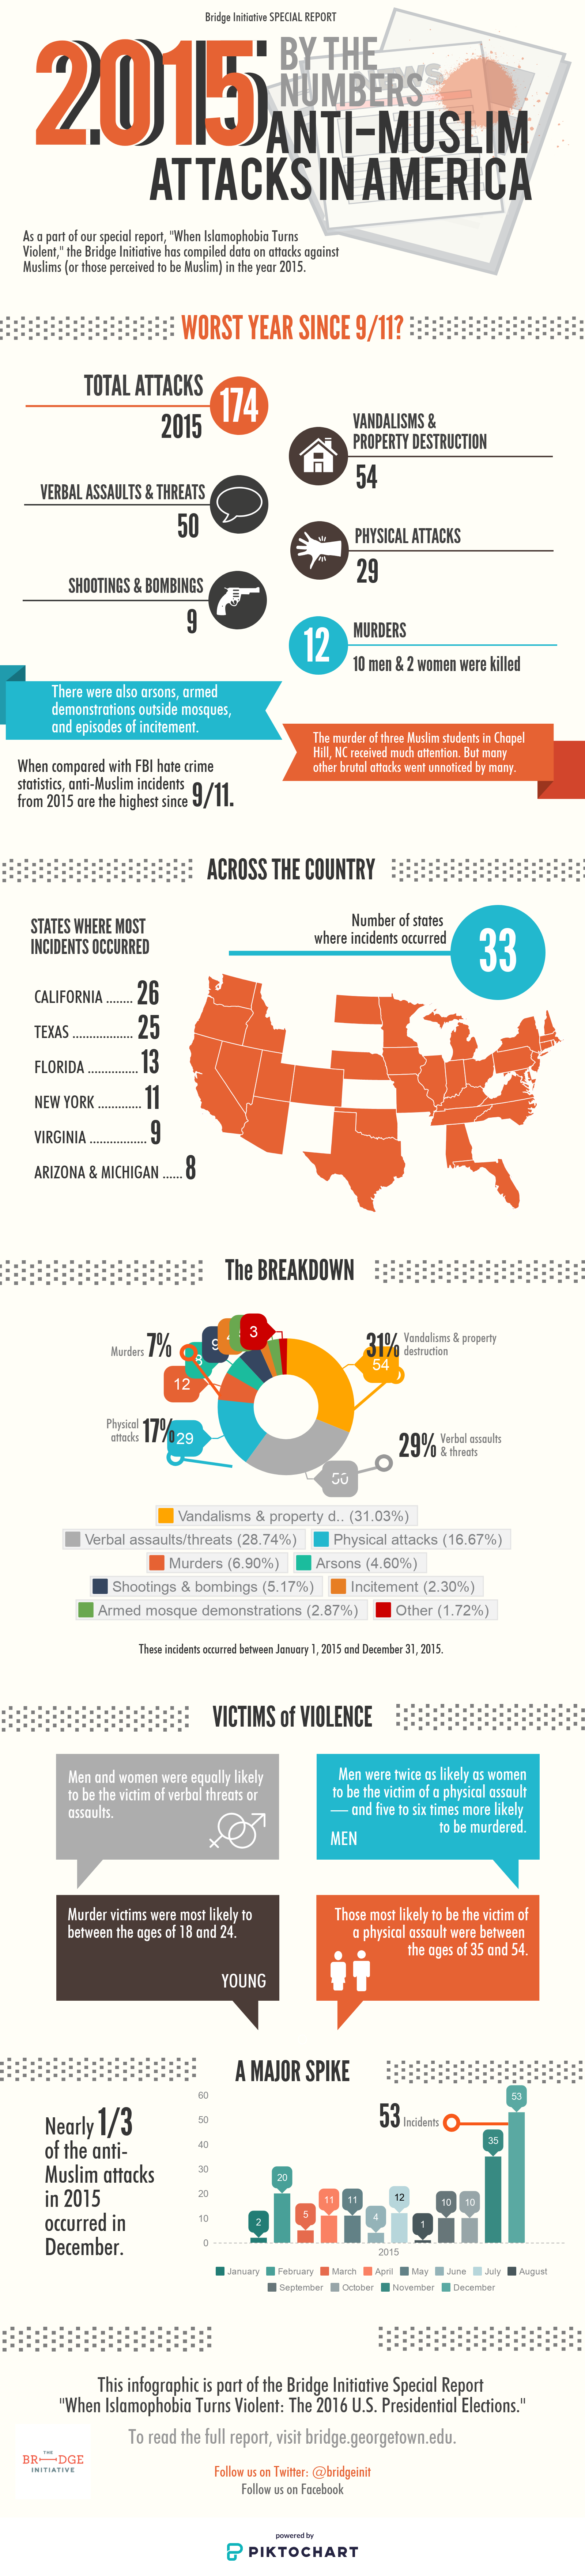
Sub Heading: Worst year since 9/11?
Description of Infographic by line:
[1] 174 Total Attacks in 2015
[2] 54 Vandalisms & Property Destructions
[3] 50 Verbal assaults & Threats
[4] 29 Physical Attacks
[5] 9 Shootings & Bombings
[6] 12 Murders (10 men and 2 women were killed)
[7] There were also arsons, armed demonstrations outside mosques, and episodes of incitement
[8] The murder of 3 students in Chapel Hill NC received much attention, but many other brutal attacks went unnoticed by many
[Line Break]
Sub Heading: Across the Country
Description: Map of the United States showing number of incidents by state
States where most incidents occurred:
California: 26
Texas: 25
Florida: 13
New York: 11
Virginia: 9
Arizona and Michigan: 8
[Line Break]
Sub Heading: The Breakdown
Description: Pie chart shows breakdown of each category of violence as a percentage of the total number of incidents.
[Clockwise from the center] 31% Vandalism and Property Damage; 29% Verbal Assault & Threats; 17% Physical Attacks; 12% Murders; 8% Arsons; 9% Shootings & Bombings; 4% Incitement; 5% Armed Mosque Demonstrations; 3% Other.
Figure description: these incidents occurred between Jan 1 2015 and Dec 31, 2015
[Line Break]
Heading: Victims of Violence
Description by row:
[1] Men and women were equally likely to be the victims of verbal threats or assaults
[1-R] Men were twice as likely as women to be the victim of a physical assault and five to six times more likely to be murdered
[2] Murder victims were most likely to be between the ages of 18 and 24
[2-R] Those most likely to be the victim of a physical assault were between the ages of 35 and 54
[Line Break]
Heading: A Major Spike
From L-R
Column 1 (L): Nearly 1/3 of the anti- Muslim attacks in 2015 occurred in December
Column 2 (R): Bar Chart shows breakdown of incidents by month in the year 2015
Incidents by month (L-R): Jan (2); Feb (20); Mar (5); Apr (11); May (11); Jun (4); Jul (12); Aug (1); Sept (10); Oct (10); Nov (35); Dec (53)
Infographic ends
This infographic is part of The Bridge Initiative’s Special Report “When Islamophobia Turns Violent: The 2016 U.S Presidential Elections”
[Bridge Initiative Logo on the bottom left]
[Follow us on Twitter @bridgeinit bottom right]